Greenfield questions

Joined
Jun 23, 2020
Messages
510
I'm looking at priority pull information. Dataset is StoreLogistics.PULL_COMPLETION_MYDAY. The dataset has a metric column that incorrectly assumes DPCI/hr is 60.0 and calculate the hours pulled as DPCI Pulled x 60 DPCI/hr (i.e. 60 DPCI pulled would display as having taken 1 hour).

Now, there is a column which appears to have the correct data, but I can't use it. completed_time_secs and completed_time_min are both the accurate time taken. When looking at individual pull batches (every time you hit start batch) I can get it to display correctly, but I can't get it to aggregate together properly. So looking at every individual batch, it's right, but if I wanted a total DPCI and total hours, I can't get it to summarize correctly.

Is there something I'm missing? Is there even a way to convert a dimension to a metric? Or is this all futile?

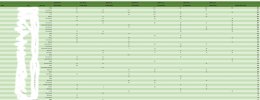
By batch:
1706931101158.png

Total:
1706931150048.png
 
I'm not sure if it helps, but I just used that dataset to make a card recently and used a calculated field called "hours_pulling" and the total looks like it's adding up correctly.
 
I'm not sure if it helps, but I just used that dataset to make a card recently and used a calculated field called "hours_pulling" and the total looks like it's adding up correctly.
Multiply that by 60 and see if it's the DPCI pulled. There's no way every TM pulls exactly at 60 every time.
 
You've come to the right place young Padawan.

I prefer the dataset StoreLogistics.Fill_Duration_v1 for the information you seek. On my card, I use 'dpci_pulled' dimension and the metric 'work_sec' to create a calculated field for time spent pulling in hours. This is the field formula: "sum(work_sec)/60/60"

Dimensions cannot be aggregated. You can cast a dimension as a numeric value, but you can’t sum it. I'm not sure if you can get what you want out of that dataset or not. I believe some of the metrics in that dataset are HQ dataset calculated fields that reference other datasets that have limited access. So you may be better off switching to the one I suggested. Also, if you PM me, I'll send you the links to my cards, which you may find useful.
 
Also, I missed this the first time, but can't you just go to "Style" on the chart tab and have it display Totals? Then it will sum everything for you.
 
You've come to the right place young Padawan.

I prefer the dataset StoreLogistics.Fill_Duration_v1 for the information you seek. On my card, I use 'dpci_pulled' dimension and the metric 'work_sec' to create a calculated field for time spent pulling in hours. This is the field formula: "sum(work_sec)/60/60"

Dimensions cannot be aggregated. You can cast a dimension as a numeric value, but you can’t sum it. I'm not sure if you can get what you want out of that dataset or not. I believe some of the metrics in that dataset are HQ dataset calculated fields that reference other datasets that have limited access. So you may be better off switching to the one I suggested. Also, if you PM me, I'll send you the links to my cards, which you may find useful.
I've looked at that one. That dataset doesn't let me break by division.
Also, I missed this the first time, but can't you just go to "Style" on the chart tab and have it display Totals? Then it will sum everything for you.
Say I'm looking at sales for each department on a table, and each department gets its own row. Normally, whether you chose to display that individually by department, or look at the store as a whole, the total would be the same. It's not working like that here.

sum("completed_time_secs") / count("completed_time_secs") / 60 / 60 will give me the correct hours when looking at each batch for each TM as its own row, but not if I'm looking only by TM.

Ultimately I'm trying to view DPCI/units/prod for each TM by division, but even without separating by division it's not working.
 
I see. I'm going to play around with later when I have a chance.

Did you try using a pivot table? That might do the trick.
 
I've played around with this at length. I am not certain it's possible to get the specific views you're looking for with this dataset, or any other. I would suggest that for the meantime, the best possible option would be to create a dashboard with at least two datasets, that informs the viewer how to derive the type of information you're looking for.
 
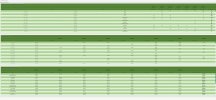
Second Attempt. As per my previous suggestion: a dashboard that combines several different views. Zoom in for a closer look. Let me know your thoughts:
filProdTest2.jpg

And yes, all my cards and dashboards use a standardized style, one that I feel gives them good readability, consistency, and aesthetic quality.
 
Last edited:
Back
Top